August Market Update
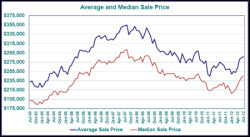
Check out my new chart below, I am now showing average and median sales price changes. All areas of real estate activity are positive when comparing July 2012 with July 2011. There were 2,372 accepted offers, 23% more than the 1,928 reported in July 2011 although down slightly (-2.6%) from last month. The 1,973 closed sales represent a 15.4% increase over the same month last year, when 1,709 were recorded. This represents the highest numberof closed sales in the month of July since 2009.
New listings rose 7.5% from 2,942 to 3,162 when comparing July 2011 to July 2012 but were down slightly (-1.4%) from the previous month. Overall real estate activity is positive when comparing July 2012 to the same month last year but down slightly from the previous month. We’ve seen a similar pattern in prior years with activity dropping in July from June highs.The unsold inventory in months ticked up slightly from 3.9 in June to 4.6 in July and is lower than any July since 2006. It would take only 4.6 months to sell the 9,041 active listings at the July rate of sales.
Home sale price measures were all positive in July. The median sales price rose 7.8% when comparing July 2012 with the same month in 2011 and 1.2% when comparing it to the previous month. When comparing the percent change of the last 12 months with the previous 12 months we see a 0.7% gain in the median price.


